Context
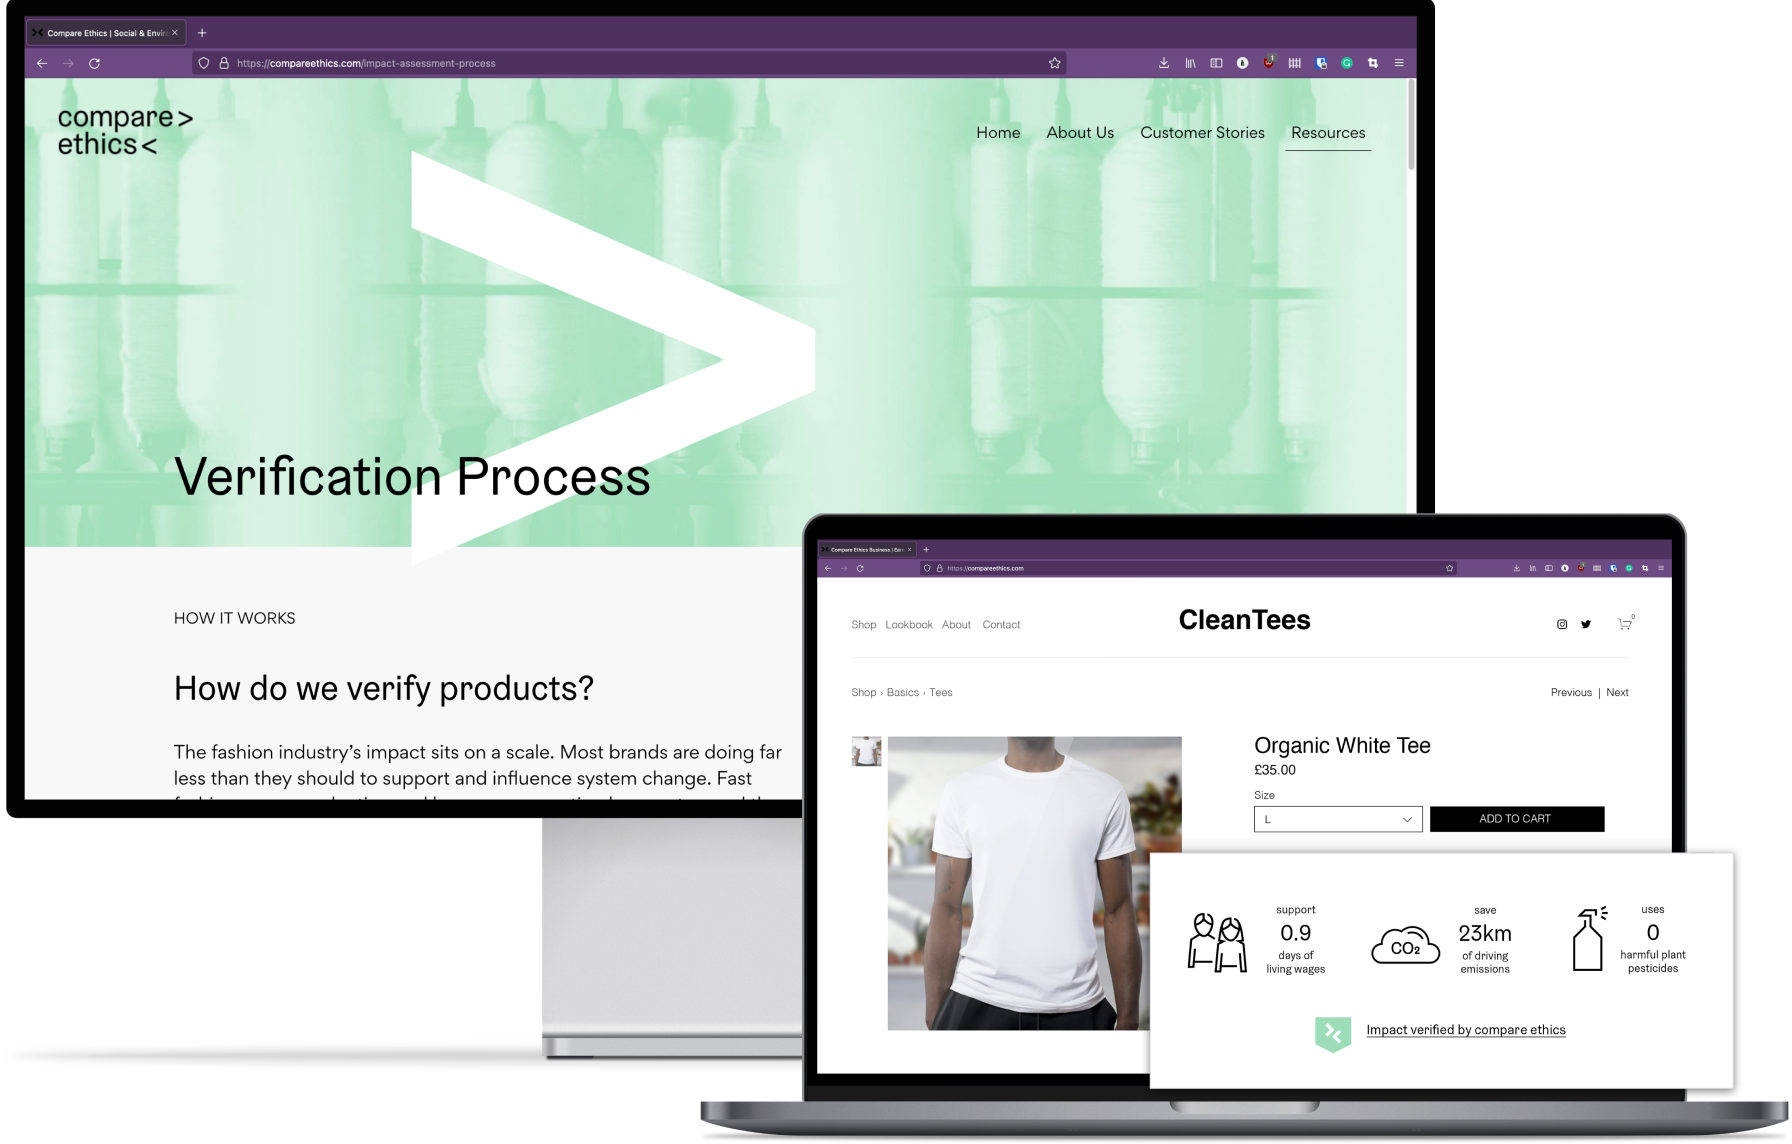
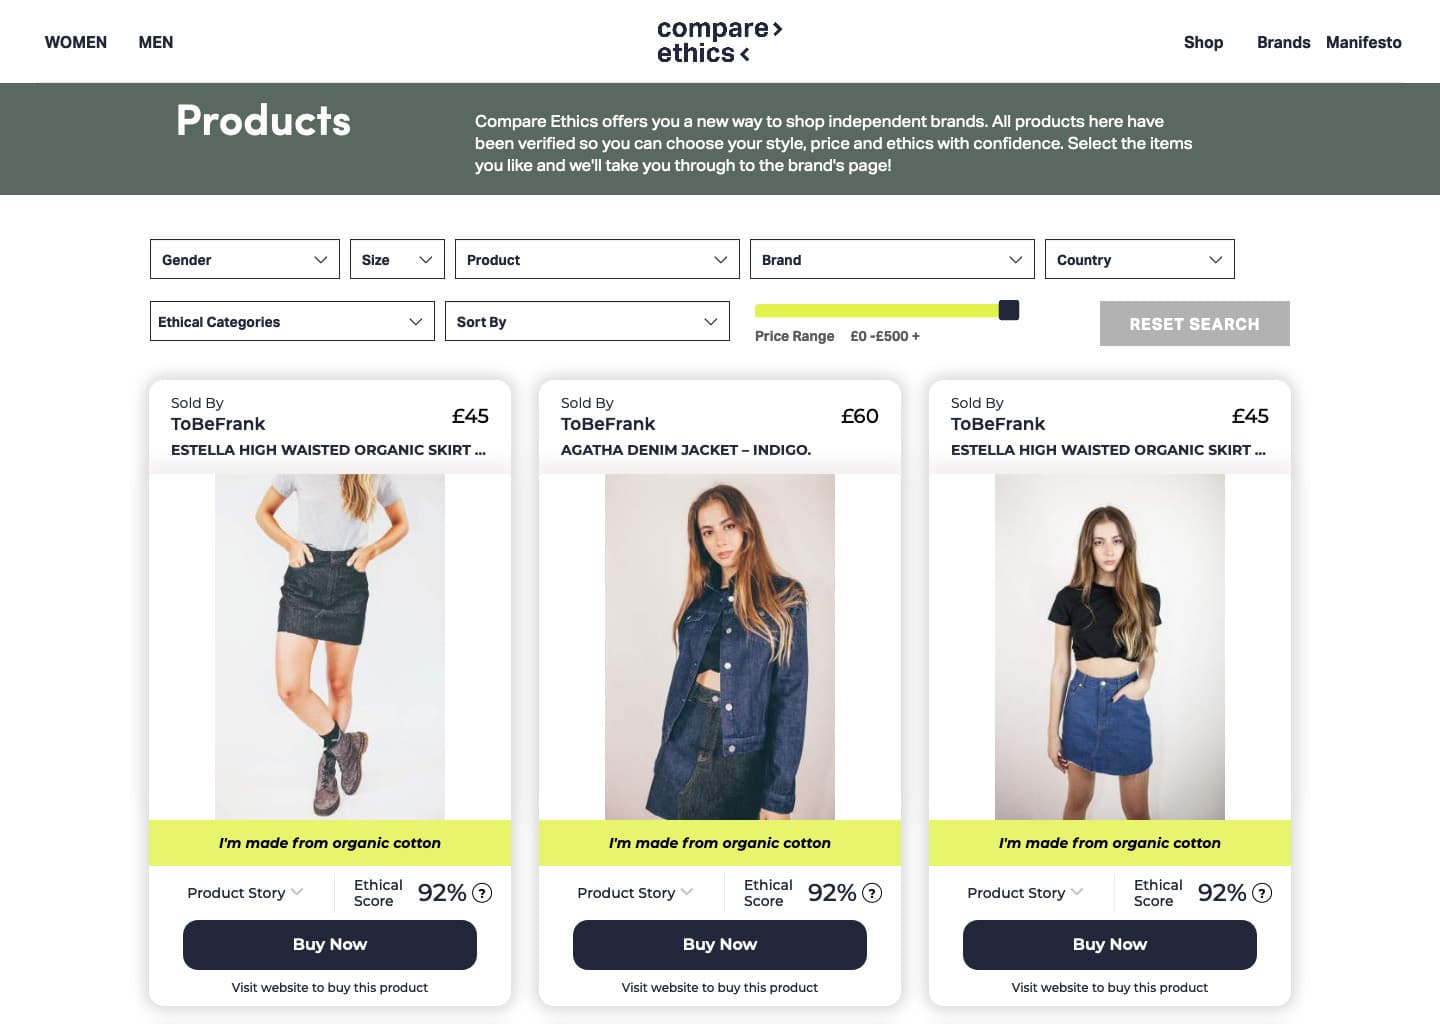
Compare Ethics is a sustainable fashion start-up that connects ethical shoppers to ethical brands through online experiences. The offering includes a comparison tool aggregating brands through a ranking algorithm. The algorithm used a point-based system per tag with a simple average across three categories. Higher scoring products are given a more prominent position on the comparison page to encourage consumer purchase. In December 2019, there were 896 products listed across 47 brands.
Project Aim & Objectives
Evaluate the existing Compare Ethics ranking algorithm to determine its fit for purpose, effectiveness, and reliability. Depending on the outcomes of this study, the algorithm may need to be amended to reflect these values. Therefore, the objectives of this project were:
- Evaluate the current algorithm, identifying its existing strengths and weaknesses.
- Propose an alternative algorithm to replace the current algorithm if it is deemed unfit.
- Propose changes to the algorithm to align with machine learning principles.
Design Process
The project was conducted using the double diamond process, where each phase was undertaken as a product sprint.
Discover
Future Casting
To understand possible future scenarios, I used horizon mapping to map the industry using strong and weak signals to understand the sustainable fashion sector better. For this exercise, Horizon 1 was 2022, Horizon 2 was 2025, and Horizon 3 was set to 2030, where local here referred to the United Kingdom.
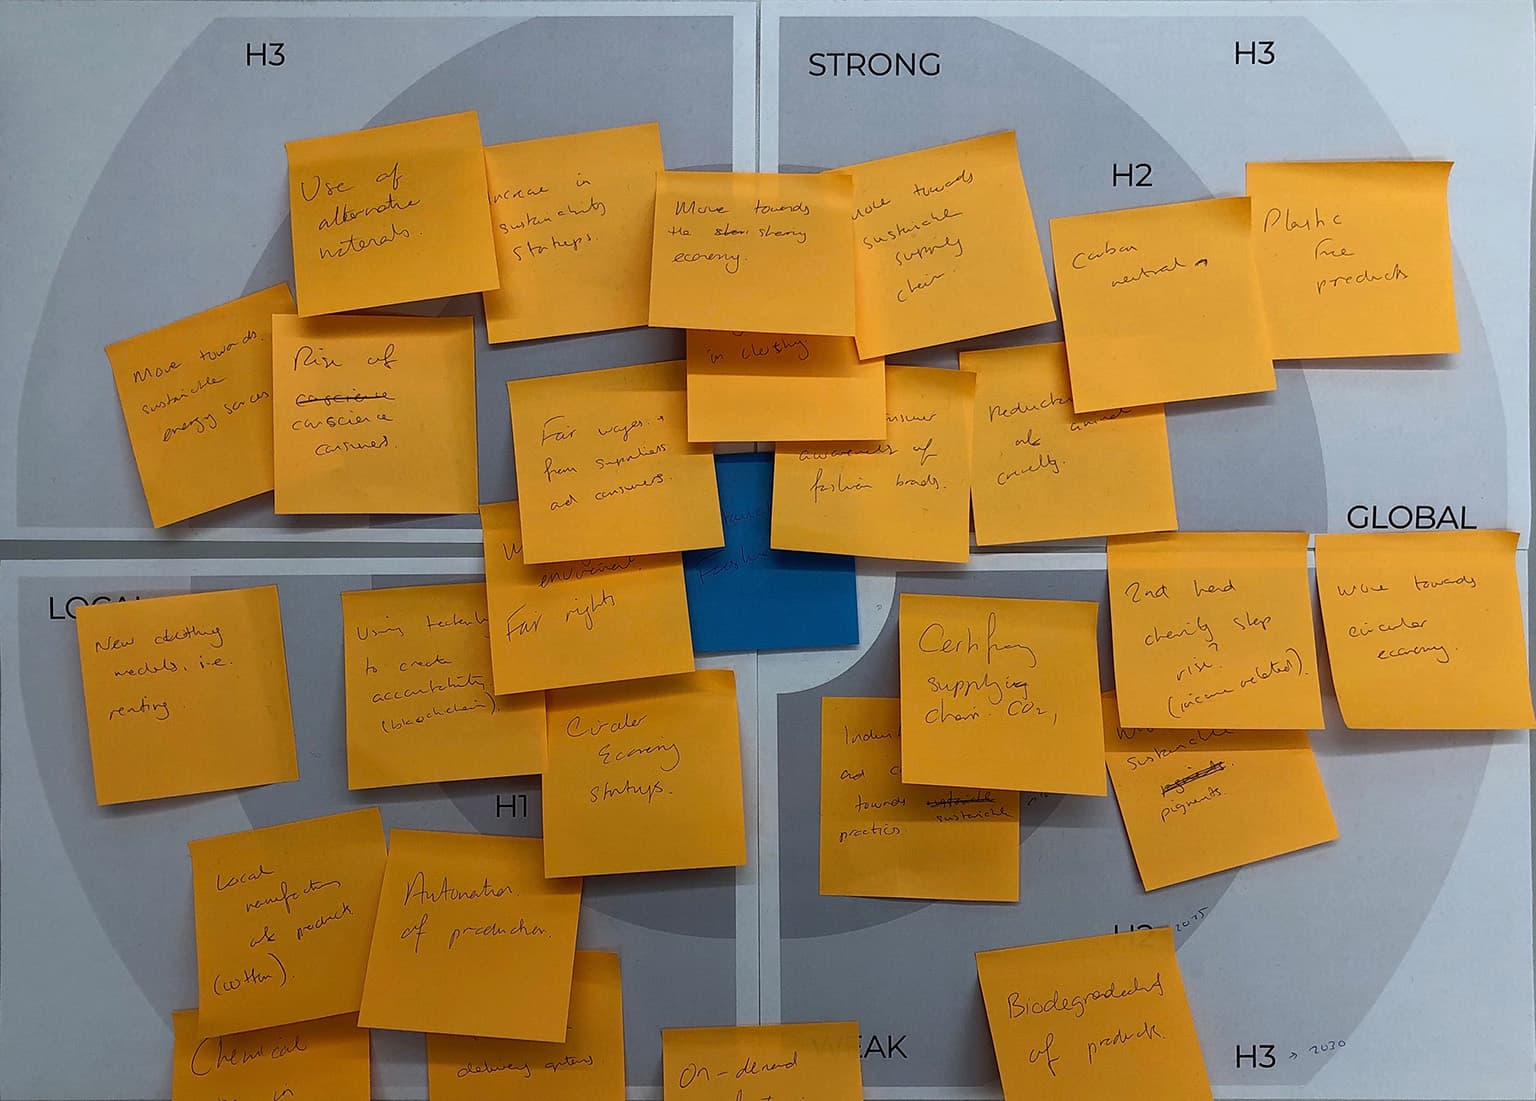
Three key insights from this exercise were:
- The sustainable fashion sector is working towards a circular economy.
- The number of sustainable fashion start-ups has increased considerably, but how they will fare in the coming years is still unknown.
- Plastic-free products are still a primary concern for customers.
Current product analysis
From there, I analysed existing products on the platform to understand how brands used the current set of tags (December 2019). In total, there were 896 products in the database. These were analysed using a combination of MySQL queries and Microsoft Excel. I found that:
6
The top 6 tags were used on more than 50% of all products.
8
8 tags were entirely unused by brands for their products.
14
On average, each product had 14 tags, with most products having 17.
50%
50% of products had between 13 & 18 tags with 95% using between 5 & 23.
Averaging techniques
The points algorithm used a simple mean after allocating points per tag. Therefore, I investigated other averaging methods to learn the impact they may have on final scores. The geometric and weighted mean were the more appropriate techniques for the new algorithm. The key advantages and disadvantages, along with the formulas of the chosen methods, are summarised in the table.
| Simple mean | Geometric mean | Weighted mean | |
|---|---|---|---|
| Advantages |
|
|
|
| Disadvantages |
|
|
|
| Formula |
Define
Creating design principles
As I continued investigating the original set of tags, I created design principles based on my insights for the new algorithm.
These insights emerged from the previous qual and quant analysis. For example, in the original algorithm, tags were duplicated across categories leading to inflated scores. Likewise, not all tags are applied to all products, therefore penalising them. For example, a brand's watch did not contain any fur, but they did not explicitly select “Free from Animal Fur”and other tags, which lowered their overall score and reduced the product's position on the platform.
The final score should be a value between 0 and 1
All sub-categories should output a value between 0 and 1
All sub-categories should be weighted by the circular economy
Tags should not be duplicated across sub-categories
Multiple specific tags should be favoured over a single ambiguous one
Tags that do not apply to a product should not penalise a product
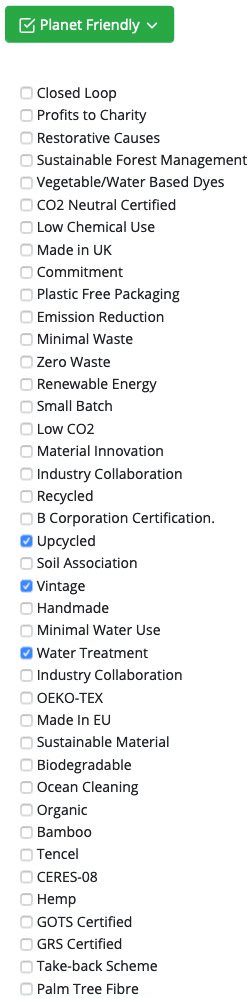
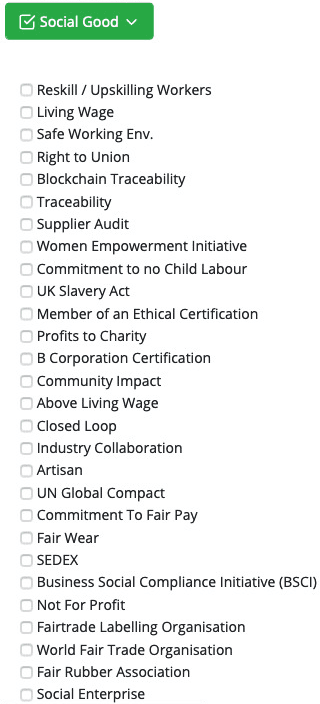
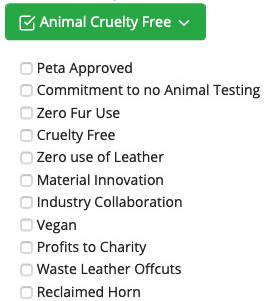
Re-organising tag categories
Once the design principles were established, the next phase included understanding the breakdown of the categories. At the time, there were three categories: Animal Friendly, Plant Friendly, and Social Good. There appeared to be an opportunity to re-arrange tags to more relevant categories and think about the algorithm's evolution in the future. One key theme that emerged from the horizon mapping and discussions from the co-founders was the promotion of the circular economy. This led to the creation of 11 new categories:
Therefore, the new categories combine the circular economy, internal & external stakeholders, manufacturing & supply chain, resource usage, and governance over 86 tags. This covers all aspects of a business function to provide a comprehensive overview of a brand and its products. The final category, “Override”, is a unique flag that reduces any brand's score to 0. This is in case a brand has been found to have discrepancies in its practices after onboarding the brand onto the platform.
Develop
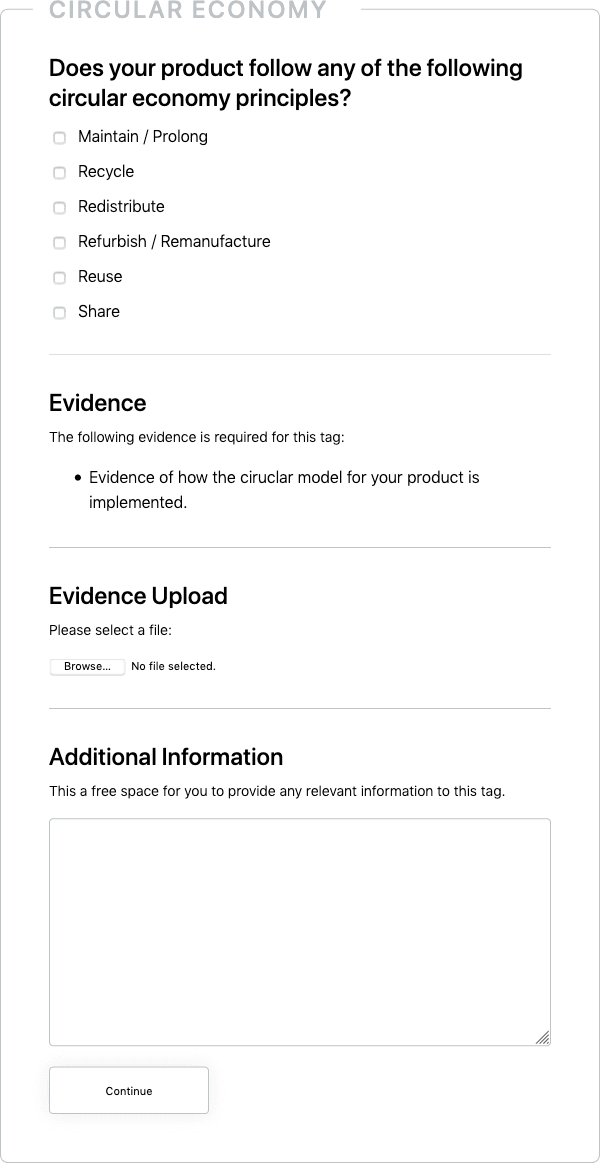
Wireframing question types
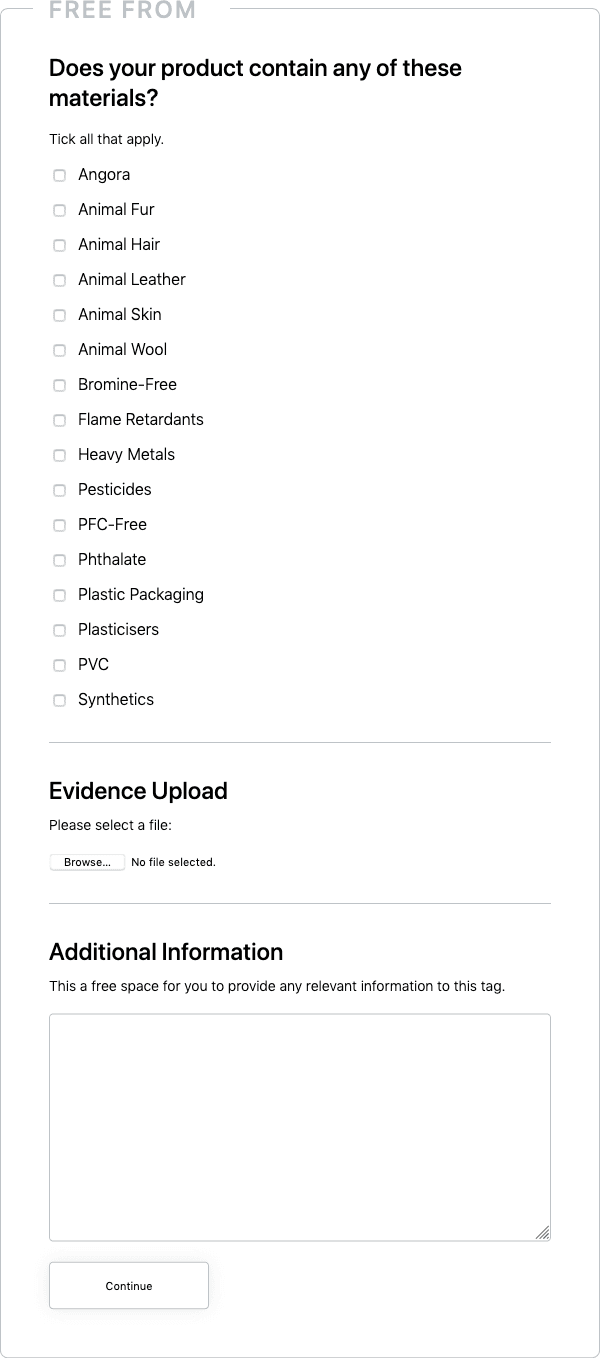
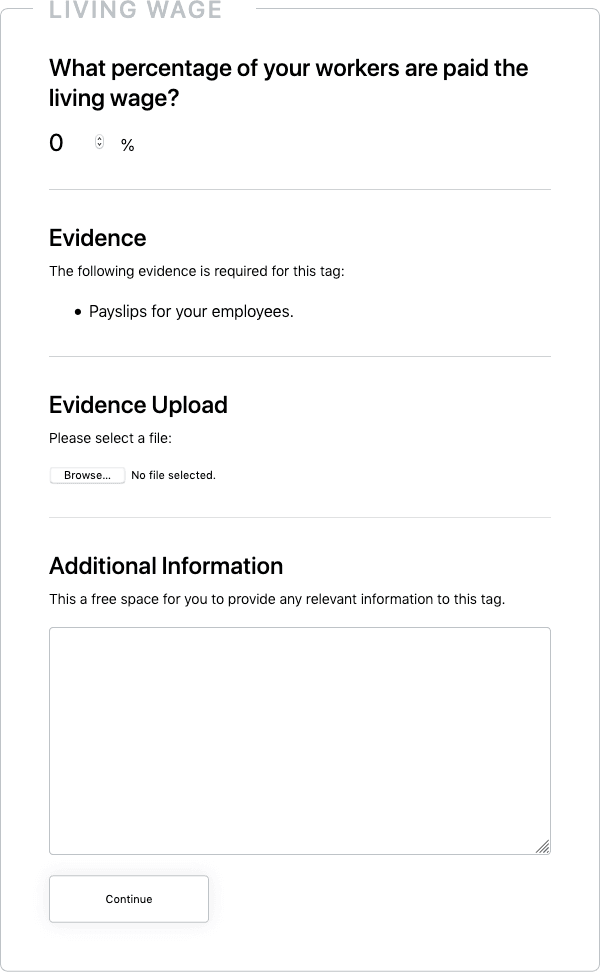
The previous product onboarding process used a checkbox system per tag to calculate the final score. In this system, tags were hard to read and could be easily missed by brands in a long list of options. Furthermore, the tags did not have explanations, leaving tags open to interpretation, leaving brands either unsure of selecting them or selecting them incorrectly.
For the new categories, each tag requires a specific type of response. These include numerical values, freeform text, and yes/no checkboxes. Therefore, the strategy was to break these into bitesize questions to allow for more thoughtful responses and address some of the issues described previously. Each question has four key components: the question itself, an explanation of the evidence required, a section to upload proof and a final freeform text area to submit additional information if the brand desires. This resulted in a more transparent and streamlined onboarding process as brands could focus on tags that applied to them.
Delivery
The final algorithm can be summarised as the following equation: R is a given product's final score, C is a row vector of the individual category scores, and W is a column vector of the weights for each category. At the time of writing, there were ten categories (excluding the “Override” category); therefore n=10.
The score of each category is independently calculated depending on the tags within the category. However, the maximum score any category can have is 1, and the lowest score any category can have is 0. This new methodology has no negative scoring within categories, the same as the current one. It should be known that the sum of the individual weights should always equal 1, as this helps normalise the final values.
Therefore, the final algorithm and score are effectively the dot product between two vectors, C and W.
Outcomes
By the end, I created a new algorithm with an expanded set of categories, rearranging the tags to appropriately reflect the values Compare Ethics aimed to promote whilst encouraging brands to adopt sustainable practices. The ranking methodology transitioned from an averaged points-based system to a weighted mean to provide a more representative overview of a brand and its products in the broader context of sustainable fashion. Finally, I created wireframes for some of the tags to demonstrate how these would be presented to the brands and the types of data that could be collected as supporting evidence to be considered for the platform.